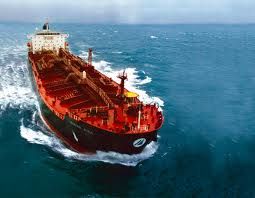
“A billion gross tonnes of shipping” has a nice ring to it. It presents the industry as a business of substance, with its 85,000 ships worth almost $1 trillion. So the news that on 1st July 2011 the world merchant fleet passed this important milestone deserves a little
reflection on where we have come from and where we are going.
55 Years of Change
The last anniversary of this sort was in 1955 when the fleet reached 100 million gross tons (see graph). But today’s fleet is very different. Of course it has grown tenfold, averaging 4.2% per year, but back in 1955 shipping was also very different. Liners and tramps dominated cargo and the premium cargo was people. Fifty six years and 100,000+ investment decisions later everything has changed. Air liners replaced passenger liners; containerships replaced cargo liners and bulkers replaced tramps. Only tankers survived and they are much bigger.
Investment Roller-Coaster
Although this sounds like neat strategic development, for shipping investors it was a nightmare because the growth path was unbelievably volatile. Business started with a surge of growth - between 1955 and 1975 the growth rate accelerated from 4% to 10.2% as investors queued up to order super-tankers and bulkers, funded by the emerging Eurodollar market. That phase peaked in 1975 and by 1985 growth had slumped to -1% (see graph). Then it all started again, with growth surging to 8+% in 2010. Part of this volatility was caused by fluctuations in trade growth which was very fast (8%pa) in the run up to the 1975 peak, then grew by just 1% pa in the 1980s and by around 3% since then. But fleet growth was supercharged by investor’s enthusiasm for playing the market using easy Eurodollar finance.
Productivity Puzzle
One surprising lesson from all this is that, despite the chaotic boom and bust environment, the industry was very successful in delivering the new technology which the globalising world economy needed - a state-of-the-art fleet of tankers, bulk carriers and containerships, all carefully graduated in size to meet the complex needs of the modern trading world for cheap sea transport. Another surprise is that the fleet’s transport “productivity” did not increase very much. In 1955 100m GT transported 820mt of cargo, about 8.2t per GT. Today 1 billion GT delivers around 8.4bn tons of cargo, an average of 8.4t per GT.
A Job Well Done
So there you have it. Shipping cycles are about getting the right ships for the trade, at the cheapest freight rates. After 100,000 angst ridden investment decisions shipping investors have really delivered the goods - a billion tons of ships, tailored to the complex needs of the modern global economy, and super low freight rates. On which note, an extra pat on the back to Capesize owners who are doing such a splendid job today, regardless of cost. Have a nice day.
Source: Clarksons
We use cookies to improve your experience. By continuing to use our site, you accept our Cookies, Privacy Policy,Terms and Conditions. Close X